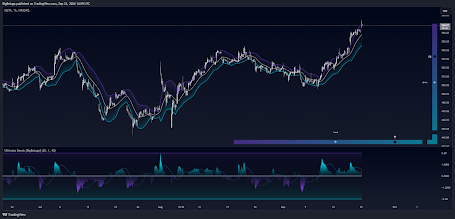
The Relative Strength Index (RSI) is a popular momentum oscillator used in technical analysis to measure the speed and change of price movements. To effectively use RSI, traders typically look for overbought and oversold conditions in the market. An RSI value above 70 generally indicates that an asset may be overbought, suggesting a potential reversal or pullback, while an RSI below 30 indicates oversold conditions and might signal a buying opportunity.
To apply the RSI in trading strategies, it is essential to consider the context of the market and combine the indicator with other tools for confirmation. For instance, a trader might wait for an RSI divergence, where the price action fails to confirm the RSI's movement, indicating a possible trend reversal. Additionally, setting a timeframe—such as looking at daily or weekly charts—can help provide a clearer picture of market momentum and give traders better insights into entry and exit points.
Moreover, traders should be cautious of relying solely on the RSI, as it can generate false signals during strong trending markets. Adjusting the RSI settings, such as using a longer period of 21 or 14, might suit different trading styles. Ultimately, successful RSI usage hinges on integrating this indicator into a broader trading strategy, while constantly evaluating market conditions and risk management practices.


0 Comments